THE PALM BEACH CONDO COLLECTION
South End Palm Beach condos.
Understand the market.
The South Ocean Boulevard collection, from Sloan’s Curve through Atriums. Building medians reflect the homes sold, their size and their condition.
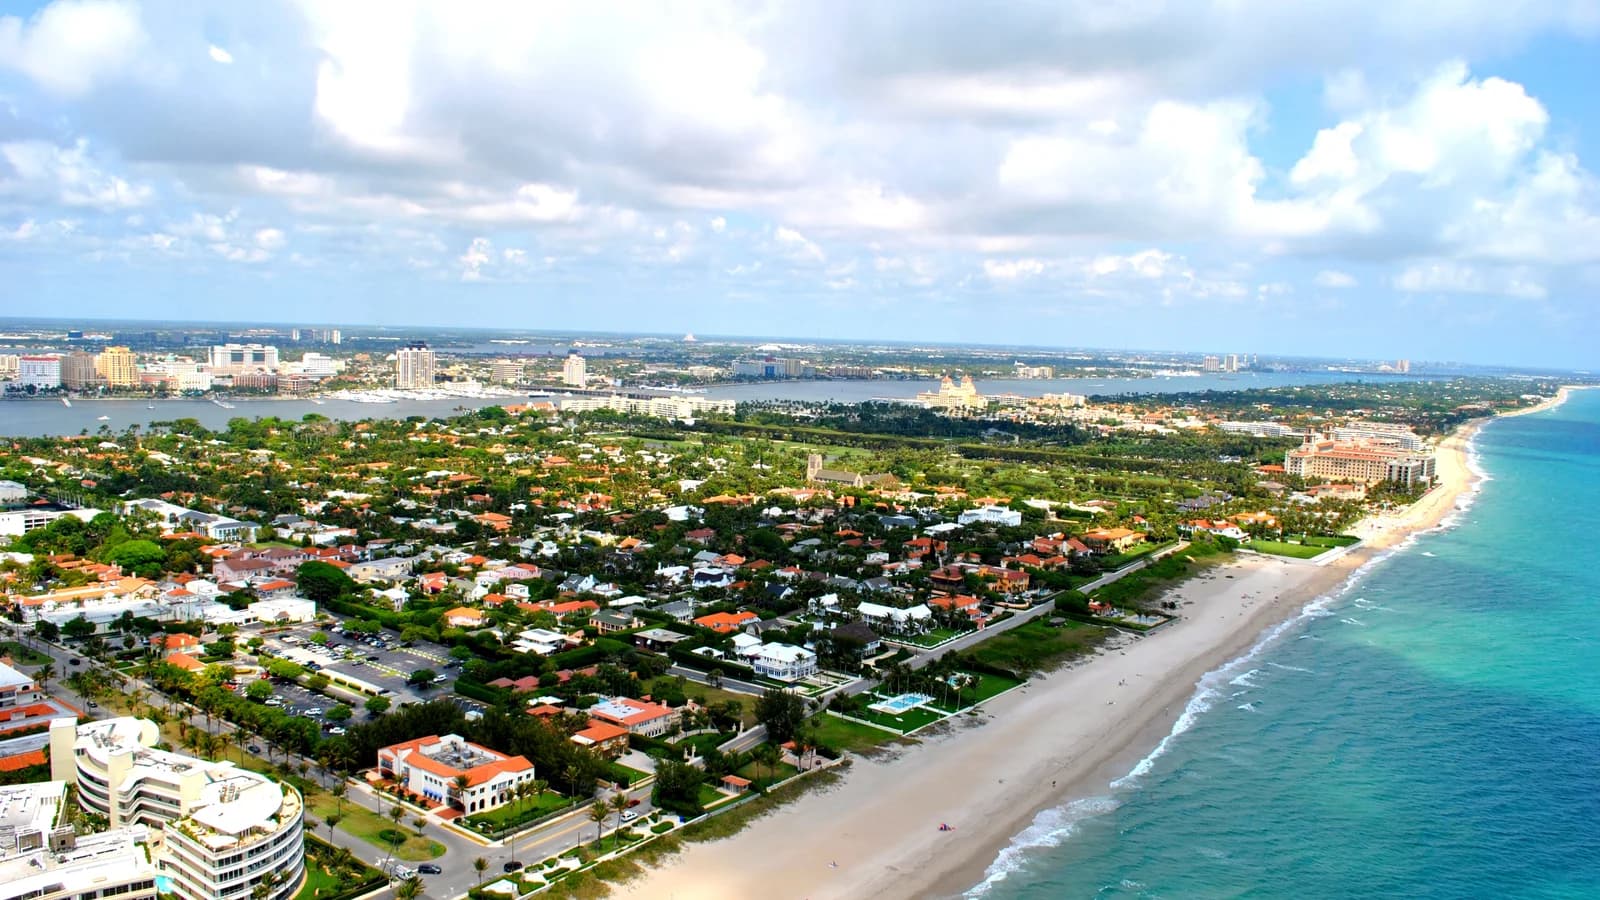
MARKET OVERVIEW
South End
Recorded closed sales · Sep 7, 2025 – Sep 6, 2026 · Matched collection only
Choose a measure to update the rankings, history and area comparisons.
BUILDING RANKINGS
Median sale price
Ranked by your selected statistic. Unavailable values stay at the end.
A longer perspective
Median sale price
Hollow points: 1–4 usable sales. Gaps: no usable observation. Current year is partial; earlier years are calendar years. Recorded history is not an individual unit’s appreciation.
View yearly median sale price & sample sizes
| Period | Median sale price | Recorded sales | Sales with price |
|---|---|---|---|
| 2026 YTD | $2,546,468 | 46 | 46 |
| 2025 | $2,250,000 | 33 | 33 |
| 2024 | $2,575,000 | 30 | 30 |
| 2023 | $2,600,000 | 34 | 34 |
| 2022 | $2,497,500 | 60 | 60 |
| 2021 | $1,387,500 | 112 | 112 |
| 2020 | $1,230,000 | 59 | 59 |
| 2019 | $910,000 | 57 | 57 |
| 2018 | $998,075 | 66 | 66 |
| 2017 | $1,022,500 | 42 | 42 |
| 2016 | $825,000 | 62 | 62 |
READ THE MARKET
South End: pricing and appreciation
From Sep 7, 2025 through Sep 6, 2026, South End recorded 53 closed sales with a median sale price of $2,600,000 (n = 53). Median sold price per living square foot was $1,049 (n = 53). Total recorded sales volume was $153,031,884. The current source snapshot contains 23 active listings and 4 listings under contract.
How much has this market appreciated since 2016?
The median sold price per living square foot changed from $394 in 2016 (n = 62) to $1,000 in 2026 YTD (n = 46), a cumulative change of +153.6%. The calculation is (YTD median sold $/SF ÷ 2016 median sold $/SF − 1) × 100. It measures the change in recorded sale medians, not the return on an individual residence.
Annual market figures · 2016–2026 YTD
| Period | Closed sales | Median sale price | Median sold $/SF | Sales volume | Usable $/SF sales | Change since 2016 |
|---|---|---|---|---|---|---|
| 2026 YTD | 46 | $2,546,468 | $1,000 | $126,586,884 | 46 | +153.6% |
| 2025 | 33 | $2,250,000 | $936 | $97,535,025 | 33 | +137.3% |
| 2024 | 30 | $2,575,000 | $1,095 | $82,593,703 | 30 | +177.6% |
| 2023 | 34 | $2,600,000 | $1,087 | $92,112,300 | 34 | +175.7% |
| 2022 | 60 | $2,497,500 | $998 | $179,156,058 | 60 | +153% |
| 2021 | 112 | $1,387,500 | $641 | $183,123,972 | 112 | +62.6% |
| 2020 | 59 | $1,230,000 | $493 | $83,802,061 | 59 | +25% |
| 2019 | 57 | $910,000 | $458 | $73,618,000 | 57 | +16.2% |
| 2018 | 66 | $998,075 | $445 | $87,876,375 | 66 | +12.8% |
| 2017 | 42 | $1,022,500 | $446 | $53,677,095 | 42 | +13.1% |
| 2016 | 62 | $825,000 | $394 | $63,726,500 | 62 | 0% |
A dash means no usable value. Historical export completeness is unconfirmed. Current-year figures cover a partial year; annual sales counts and volume are not directly comparable with completed years. Sources and calculation methods →
ACROSS THE ISLAND
Put the areas side by side.
Recorded MLS activity, not the entire island market. Historical export completeness is unconfirmed; sparse years may give unstable medians. 300 South Ocean is excluded from totals. Read the methodology ↗